Structure and Profile
|
Number of students
|
Age structure
|
Structure
|
|||||
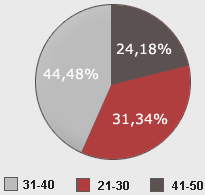
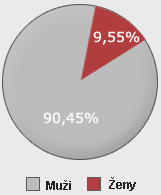
| 21-30 | 31-40 | 41-50 | Men | Women | |||
| Absolutely | 105 | 149 | 81 | 303 | 32 | ||
| Percentage | 31,34% | 44,48% | 24,18% | 90,45% | 9,55% | ||
|
|||||||
|
Number of students
|
Qualification structure
|
Employment structure
|
||||||||
|
|
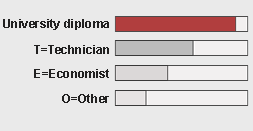
University diploma
|
E
|
T
|
O
|
TM
|
M
|
O
|
|||
| Absolutely |
315
|
102
|
193
|
40
|
135
|
186
|
14
|
|||
| Percentage |
94,03%
|
30,45%
|
57,61%
|
11,94%
|
40,30%
|
55,52%
|
4,18%
|
|||
|
||||||||||